スペクトログラムの学習用データの生成を自動化する [AI]
スペクトログラムの学習用データの生成の続きです。前回、一つのスペクトログラムのデータから複数の学習用データを生成する基本的な処理が出来上がりましたので、今回は学習用データを量産してみたいと思います。
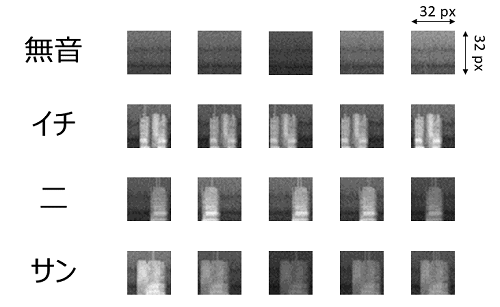
前回と同じくデータは、”イチ”、”二”、”サン”の3つ。それに無音も認識が必要なので無音のノイズデータの4点です。学習用の画像データは32x32の大きさにしました。結果から出してしまいますが、次のようなデータが生成されました。
Python のスケッチを次にあげておきます。見通しをよくするために幾つか関数に分離をしていますが、前回のアルゴリズムをそのまま踏襲しています。追加した処理は、次の3点です。
(1) 無音時のノイズ処理(スペクトラムの範囲を決められない為)
(2) ランダムにシフト量とゲイン量を算出する処理
(3) スペクトラムをリサイズして画像として保存する処理
おそらく実機では、マイクのノイズやゲイン量が大きく影響するので作り直しになると思いますが、このスケッチそのものはパラメータなどを変更することで流用できそうです。
(^^)/~


前回と同じくデータは、”イチ”、”二”、”サン”の3つ。それに無音も認識が必要なので無音のノイズデータの4点です。学習用の画像データは32x32の大きさにしました。結果から出してしまいますが、次のようなデータが生成されました。
Python のスケッチを次にあげておきます。見通しをよくするために幾つか関数に分離をしていますが、前回のアルゴリズムをそのまま踏襲しています。追加した処理は、次の3点です。
(1) 無音時のノイズ処理(スペクトラムの範囲を決められない為)
(2) ランダムにシフト量とゲイン量を算出する処理
(3) スペクトラムをリサイズして画像として保存する処理
import numpy as np
import cv2 as cv
import random
import os
import scipy.io.wavfile as wav
from matplotlib import pyplot as plt
from numpy.lib import stride_tricks
from numpy.lib.stride_tricks import as_strided
from numpy.fft import rfft

""" short time fourier transform of audio signal """
def stft(samples, frameSize, overlapFac = 0.5, window = np.hanning):
    win = window(frameSize)
    hopSize = int(frameSize - np.floor(overlapFac * frameSize))

    # cols for windowing
    cols = np.floor(len(samples) / hopSize) - 1
    # print("cols: ", cols)

    # make an array in 2nd dimension with hopSize
    frames = as_strided(samples, shape=(int(cols), frameSize), strides = (samples.strides[0] * hopSize, samples.strides[0])).copy()
    frames = frames * win

    return rfft(frames)

def spectrogram_detector(spectrogram):
    spectro_mean = np.mean(spectrogram, axis=1)
    threshold = np.ceil(np.mean(spectro_mean))
    threshold = np.ceil(np.mean(spectro_mean[spectro_mean <= threshold]))  # pick up only noise signals
    print("threshold: ", threshold)
    offset = 5
    up_trigger = 0
    down_trigger = 0
    for i in range(offset, spectro_mean.shape[0]-offset):
        cur_floor = int(np.mean(spectro_mean[i:i+offset-1]))
        pre_floor = int(np.mean(spectro_mean[i-offset:i-1]))
        if ((cur_floor > threshold) and (pre_floor <= threshold) and (up_trigger == 0)):
            up_trigger = i
        if ((cur_floor <= threshold) and (pre_floor > threshold)):
            down_trigger = i
    print("up_trigger  : ", up_trigger)
    print("down_trigger: ", down_trigger)
    return up_trigger, down_trigger


def augmentator(spectrogram, left, right, signal):
    axis_max = spectrogram.shape[0]
    if (signal == 0): # in case of zero1.wav
        left = random.randint(0, np.floor(axis_max/2))
        right = random.randint(np.ceil(axis_max/2), axis_max-1)
    left_or_right = random.randint(0,1)
    if (left_or_right > 0): # 1 is right, 0 is left
        move = random.randint(right, axis_max-1)
        move = move - right
    else:
        move = random.randint(0,left)
        move = -move
    print("move: ", move)

    spectrogram_result = spectrogram.copy()
    spectrogram_body = spectrogram[left:right, :] # extract spectoram data

    #if the shift is left, the value is minus, the shift is right, tha value is plus
    if (move < 0):
        spectrogram_noise = spectrogram[left+move:left,:]
        spectrogram_result[left+move:right+move,:] = spectrogram_body
        spectrogram_result[right+move:right,:] = spectrogram_noise
    elif (move > 0):
        spectrogram_noise = spectrogram[right:right+move,:]
        spectrogram_result[left+move:right+move,:] = spectrogram_body
        spectrogram_result[left:left+move,:] = spectrogram_noise

    max_gain = 255 / np.max(spectrogram)   # maximum gain
    gain = random.uniform(0.67, max_gain)
    print("gain: ", gain)
    return spectrogram_result * gain

def plot_spectrogram(spectrogram, time_axis, freq_axis, time_interval, frequency_map):
    plt.figure(figsize=(16, 8))
    plt.imshow(np.transpose(spectrogram), origin="lower", aspect="auto", cmap="jet", interpolation="none")
    plt.colorbar()

    plt.xlabel("time (s)")
    plt.ylabel("frequency (hz)")
    plt.xlim([0, time_axis-1])
    plt.ylim([0, freq_axis-1])

    xlocs = np.float32(np.linspace(0, time_axis-1, 5))
    plt.xticks(xlocs, ["%.02f" % i for i in (xlocs * time_interval)])
    ylocs = np.int16(np.floor(np.linspace(0, freq_axis-1, 10)))
    plt.yticks(ylocs, ["%.02f" % frequency_map[i] for i in ylocs])

    plt.show()

def gen_spectrogram(wavfile, frameSize):
    sample_rate, samples = wav.read(wavfile)
    print("sample_rate:", sample_rate)
    print("num_of_samples:", len(samples))

    spectrogram = stft(samples, frameSize)
    frequency_map = np.fft.fftfreq(frameSize, 1. / sample_rate)
    spectrogram = 20. * np.log10(np.abs(spectrogram)) # amplitude to decibel

    # spectrogaram has an extra colum, so slice it
    spectrogram = spectrogram[:,:int(np.floor(frameSize/2))]
    spectrogram -= np.min(spectrogram) # normalize

    return spectrogram, sample_rate, frequency_map

def main():
    frameSize = 256
    output_img_size = 32
    num_of_augdata = 5
    wavfiles = ['./wav/zero1.wav', './wav/ichi1.wav', './wav/ni1.wav', './wav/san1.wav']

    for i in range(len(wavfiles)):
        print(wavfiles[i])
        spectrogram, sample_rate, frequency_map = gen_spectrogram(wavfiles[i], frameSize)
        time_dim, freq_dim = np.shape(spectrogram)
        time_interval = frameSize / sample_rate
        plot_spectrogram(spectrogram, time_dim, freq_dim, time_interval, frequency_map)

        # detect the range of spectrogram signal
        left, right = spectrogram_detector(spectrogram)

        data_dir = "./" + str(i)
        if not os.path.exists(data_dir):
            os.mkdir(data_dir)
        for n in range(num_of_augdata):
            # spectrogram data augmentator
            spectro_aug = augmentator(spectrogram, left, right, i)
            # plot_spectrogram(spectro_aug, time_dim, freq_dim, time_interval, frequency_map)

            spectro_aug.astype(np.uint8)
            spectro_img = cv.resize(spectro_aug, (output_img_size, output_img_size))
            spectro_img = np.rot90(spectro_img)
            data_path = data_dir + "/" + str(n) + ".bmp"
            cv.imwrite(data_path, spectro_img)

if __name__ == "__main__":
    main()
おそらく実機では、マイクのノイズやゲイン量が大きく影響するので作り直しになると思いますが、このスケッチそのものはパラメータなどを変更することで流用できそうです。
(^^)/~
- 出版社/メーカー: コロナ社
- 発売日: 2018/04/04
- メディア: 単行本
データサイエンス教本 Pythonで学ぶ統計分析・パターン認識・深層学習・信号処理・時系列データ分析
- 出版社/メーカー: オーム社
- 発売日: 2019/01/18
- メディア: Kindle版
Pythonデータサイエンスハンドブック ―Jupyter、NumPy、pandas、Matplotlib、scikit-learnを使ったデータ分析、機械学習
- 出版社/メーカー: オライリージャパン
- 発売日: 2018/05/26
- メディア: 単行本(ソフトカバー)
ys_taro さん

-
nice! 35196
記事 1099
テーマ 趣味・カルチャー
プロフィール
Contact Me


コメント 0